Wednesday, June 29, 2011

Hurry Up and Wait Please

Photo by Karina Gerbst

My patience on Sketcher's (SKX) seems to be working. It was up nicely yesterday. The news from Nike (NKE) , Crocs (CROX), Timberland(TBL) et al are boosting interest in this sector.

Sketchers is a battered down value stock. Other than defining the idiom "A rising tide lifts all boats", what else is happening here? Well, I do see change. Sketcher's main customer Brown Shoe (BWS) had a good earnings report last week. I hope this is a sign that the stuffed inventory channels are thinning out. Sketcher's has its own e-commerce shoe website. Its shoe prices for their "Toner shoes" seem to have come down slightly. I am hoping that their new pricing is the adjustment needed to boost demand. Looking at the upcoming seasons, the "Back-To-School" and Christmas sales will help tremendously.

Sketcher's is the only publicly traded company that sells the "Toner Shoe" style. Reebok & Asics are the other main sources of this style of shoe and are privately owned. If you want a stake in this new market and you're not Warren Buffet who can buy the whole company when he likes an equity, then SKX is your only choice.


 The controversy seems to be that Sketchers is now trying to enter and compete within the crowded fitness shoe arena. “Skechers Fitness has grown from a single style into a performance running line, training line, and an everyday toning line,” Skechers President Michael Greenberg said in a statement. "The apparel collection will build on the company’s Sketcher Fitness Footwear line, which now includes technical running shoes as well as styles designed for training and all-day wear." The new line is coming in 2012.

According to SeekingAlpha
Sketchers’ current attempt to expand the recognition of its brand into other realms of footwear may invariably diminish the perceived and/or actual focus of the brand on providing products appreciated by loyal consumers. Skateboarders and individuals who wear toning shoes appear, at least at first glance, to be unrelated groups of consumers....

How can you rate the current sentiment?
Comparing the current quarter earnings to last year's quarter, the results will be more of a measure of progress than an actual beat; However, the current consensus is that there will be vast improvement in the last half of the year.

The next earnings report is July 25th. Barring an early press release announcement, what could you use to read the current sentiment on SKX? The July 2011 options expire on July 15th, before the reporting period and the August 2011 options expire after the report.

Using the premise that an option straddle is a hedged bet composed of calls and puts can a price range be defined by the break-even points? I would like to experiment with a weighted blend of prices for a range of options for the next 30 days. Just like the VIX, would you be able to find a range of prices, and actually measure the incremental wisdom of the total crowd? The VIX volatility index is used by options traders to calculate options premiums (i.e. options prices), and also by S&P 500 traders to determine the expected daily range for the S&P 500 stock index and futures market. Only I would be doing it for one stock. The math may be over my head. Need to do more homework....

It seems to be a very volatile range. Prior to yesterday's run-up the range was quite different than this morning. But a simplified historical range of stock prices might be a more powerful piece to the puzzle that I thought.

Monday, June 27, 2011

$NOK as Penny Stock

[guest post by ..TS.]
You probably would have never thought of Nokia as a penny stock, especially has it still has some $60B in sales and a $20B market cap, but it's stock price recently dropped below $6, putting it in spitting distance of the $5/sh definition for a penny stock.  Just as Citigroup, Ford were once penny stocks, and very nearly GE, Nokia, which has been a major force in mobile telecommunications for decades, has nearly touched these fabled depths.

How do we play penny stocks?  Well, generally, we're advised to steer clear of them.  But, remember, penny stocks can generate the greatest returns in one's portfolios, especially if news and/or results bring them back from the proverbial brink.  Realistically, what company with some $15B in cash is really at the brink?  Well, RIMM has $20B in cash, and look at it's gyrations.

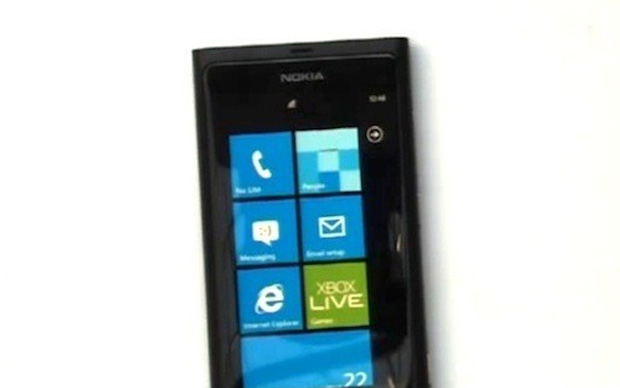
Now, I have not implemented exhaustive research on $NOK, but based on a couple of flimsy items, I plunged into a bunch of calls at $9 and $10 for Jan 2012 early this morning:  they just leaked details of a Windows Mobile touch phone, they just hit a 52-week low, and... I just have a vague feeling their management doesn't want to be seen as roadkill along the telecom/info highway.  A Windows Mobile phone? Really?  With new iPhones coming out every two weeks?  Well, now that Microsoft and Nokia are the mobile underdogs (and better positioned than Palm ever was), they should be able to gently gobble marketshare back from Apple.

What do you think?  Rash?  Ridiculous? Irresponsible? Let us know.

..TS.

Intuition and perfect information

Any idea I can think of is already out there. That's not suppose to be a depressing thought. My new idea or intuition has already been invented, and has a blog or group following waiting to be discovered. A complete new world that sees things from a different perspective. I suck at math, even thought I had way too much of it years ago; Maybe, I have just forgotten most of it from disuse. No, I suck at calculus. But that doesn't stop me from getting nuggets of ideas from quantitative finance theory. Intuition is a very useful thing. Use it as confirmation that you are headed down the right path.

Apply that to any idea or perspective. Follow that information into another parallel universe. Follow the path down "the rabbit hole".

Friday, June 24, 2011

Are Short-Term Value plays an Oxymoron?

I lean towards battered down "value" stocks. I find a stock and then get extremely excited; However, when I start writing, talking or doing research, I need to remember to constantly suppress my cognitive biases. There are too many to mention, but the biases that apply to this post are:
  • the tendency of someone to overestimate the probability of a favorable outcome coming to pass in a given situation
  • inaccurately perceiving a relationship between two events, either because of prejudice or selective processing of information.
  • ignoring an obvious (negative) situation.
  • excessive confidence in one's own answers to questions.
Please bear with me on that last one - Overconfidence. How can an introvert like me have such wild mood swings? The narrative goes as follows: I find a stock and get extremely excited. If you did a Google search on the definition of conviction, my picture would show up. Time passes and nothing has happened, I start to doubt myself. I finally sell in frustration and depression.

Is a Short-Term Value Play an oxymoron?
TrashStocks says:
"Absolutely not.  Value can exist for a short time.  Day traders bet on it.  How do you define value?  Is value buy-and-hold? or are there value "windows"? 1 day, 1 week, 1 month, 1 year, 1 decade?
interesting idea...
just as a bubble is essentially a window of opportunity, both for momentum traders and for people who short stocks.
momentum on the way up, shorts on the way down" 

War Stories
We all can recount of a memorable personal experience, especially one involving challenge, hardship, danger, or other interesting features.  As my limited trading experience increases I will accumulate these war stories.  This will wean me from a lot of these biases. Of the remaining list, I will just need to be more disciplined.

One bias I hope I don't lose is the tendency to seek information even when it cannot affect action. This has served me well in the past. My latest battered dog is Brightpoint, Inc (CELL). It is a good company that has been battered down because of an announcement by AT&T that they are acquiring T-Mobile. The perception is that CELL would likely lose its current contracts and be shut-out from the newly merged behemoth.

Wall Street Journal has stated
"Overall growth in wireless customers on monthly contracts has stalled as the market has become saturated. Sprint, AT&T and Verizon have all managed to keep a tight grip on their customers, but T-Mobile's losses of contract customers accelerated to 471,000 in the first quarter from 318,000 in the fourth quarter and 60,000 in the third."
Conclusion
The much-publicized AT&T merger with T-Mobile is not a "done deal;" it will likely be next year before a decision is made on whether to allow the country's second and fourth largest wireless operators to merge.

Thursday, June 23, 2011

Momentum Trading $CROX?

[guest post by TS]

Somebody-perhaps several somebody's-is/are expecting $CROX to hit 26 by July - they bought 500 $26 Calls at .55 - if it hits $26, they'll triple their money.

Before I could join the party, the contracts went up $.05... The July $25's have also just seen a bunch of activity.

Does this action qualify $CROX as a momo play?

..TS.

[Editors Note: as of market close on July 6th, the July 11 $26 call's are up 185%, closing with a bid of $1.70...the referenced traders on June 23rd have now slightly more than tripled their money.  CROX underlying closed today at $27.62.]
[2011-07-12: and right back down:
| 26.00 || CROX110716C00026000 || 0.70 || Down || 0.01 || 0.55 || 0.65 || 74 3,766 | ]

Monday, June 20, 2011

Volume Indicator Experiment

Let's turn up the Spinal Tap Amps here...
In the equities market, high volume can occur from capitulation or irrational exuberance. In fact, conventional wisdom has traders looking for equities with volatility spikes as a trigger. The problem is that high volume can occur anywhere along the cyclical range of an equity. It can occur at the bottom of the range, the middle run, or the top of the range.

What started this First Experiment
This thought process started with the idea that price, volume and $volume [price * volume] give different information to a trader; However, can the same technical indicators for price be used for volume or $volume?

There are several forward looking technical indicators for price volatility, such as the S&P volatility index ($VIX) &  CBOE Nasdaq Volatility Index ($VXN). There are several backward looking technical indicators for price.

First Experiment
What if the key to volume analysis is not the high volume signal, but the appearance of a low volume tick. Low volume indicates indecision or indifference. This volume data should be looked at in relative terms.

A backwards indicator for price is the relative strength indicator (RSI). I took the RSI indicator and used it on an equities' historical volume data. The volume data is very erratic but it did show a trend. Volume can vary tremendously from one day to the next or it can remain constant for months. What was interesting was to  increase/decrease the time period averages to de-emphasize/expose a volatility spike. For example, using the standard 14 period average seemed too long for the volume data trend.

Second Experiment
I'm in the middle of taking the S&P ($SPY) historical volume data RSI and comparing it to an individual equities' volume RSI. It is requiring  longer time frames to even out cyclical trends. For example, the S&P could be at the top of its periodic range and the individual equity could be at its bottom.  Maybe I could work out a correlated volatility of the broader market as a whole. Sort of like a Beta of volume volatility. Send me a note if you think of something.

Conclusion
With a quick glance towards the equities market, it appears that low volume is a forewarning of a spike in volume. Barring any external events, does the length of the relative calm indicate indecision or indifference?

What about a forward looking indicator? Can you think of a predictive volume indicator, usually based on another criteria, that can be modified?

Saturday, June 18, 2011

Follow theTrend mantra, but watch the street signs

In the efficient-market hypothesis (EMH) there is an assumption that all the smart investors will know what to buy or sell, so the retail investors should just follow them.

If you could ask a trading legend any question what would it be? Can I drive your Ferrari? No? What is the "Holy Grail"? Why are the people doing what they are doing?...... If someone like me were lucky enough to be able to approach a legend, I would not waste his time with unanswerable questions. I would look for ways that would help him, as well as help myself in my trading.


Watch out for the stop signs!
If you viewed research as a Google Maps web mapping application you could visualize it as starting off with a view of the whole world. The "follow the trend" mantra would give you a road map of the local  neighborhoods. Look around for a different prospective and read articles from different fields. The leading gurus would narrow it down to the right "street view" level;  But you have to observe which way the street signs are pointing.